MALARIA COMMODITIES DASHBOARD FOR ENHANCING EFFICIENCY IN HEALTH COMMODITIES MANAGEMENT.
The Kenya Malaria Strategy 2019-2023 has the goal of reducing malaria incidence and deaths by 75% of the 2016 levels by 2023. Malaria elimination is a dynamic process leveraging sustainable interventions that will prevent reemergence of the disease. Efficient investments in malaria elimination for any country has to be guided by reliable data on the demand and utilization grouped by population and location. The five malaria epidemiological zones in Kenya include the lake endemic, coastal endemic, highland epidemic, semi-arid, seasonal transmission and low risk areas (See Figure 1).

Malaria Commodities Dashboard
HealthIT is a USAID funded activity whose goal is to contribute towards enhancing evidence-based decision making by all health sector stakeholders through leveraging and strengthening integrated health information systems. Although malaria logistics management data has been available in the Kenya Health Information System (KHIS) since 2014, the situation prior to 2016 was such that usage of consumption and stock on hand data to inform forecasting and supply planning was happening primarily at the national level and less at the devolved levels. HealthIT worked with the Ministry of Health, Division of National Malaria Program (DNMP), Kenya Medical Supplies Authority (KEMSA), Afya Ugavi, and counties to offer technical support in the development of the Malaria Commodities Dashboard (MCD). The activity carried out sensitization sessions to train national and county officials on the use of the platform to help solve some of the challenges experienced in malaria commodity management. So far, 84 national and county officials across 12 counties have been trained on the use of the malaria commodities dashboard by HealthIT.
Some of the challenges experienced in malaria commodity management at all levels included: lack of visibility of stocks held at facilities resulting to inappropriate stock holding within the county, inconsistent availability of life 2saving commodities across health facilities, difficulty for health workers to visualize and analyze data submitted monthly to the national health information system, poor data quality due to lack of institutionalized mechanisms at the county level to review and use data, sub-par use of supply chain data for decision making and inability to evaluate supply chain performance at peripheral level.
Before the Malaria Commodity Dashboard was set up, we used to have the malaria order form which was more of paper work and wasn’t based on any data. The orders weren’t specific and reliable says Dr. Wambulwa Bernard, County Pharmacist Kakamega County
How it works
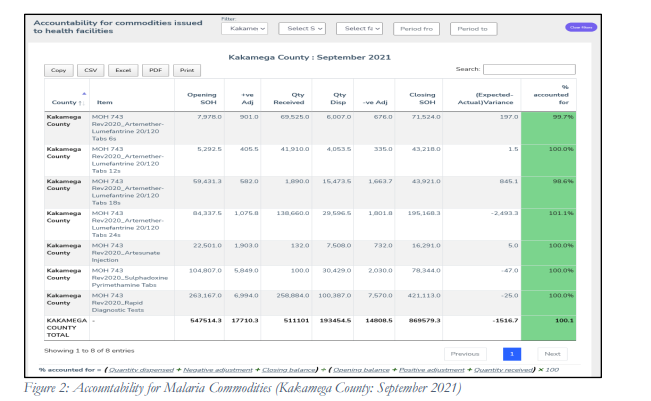
The malaria commodities dashboard automatically generates reports such as county malaria commodity stock status, health facility stock status, KEMSA stock status and months of stock by commodity. The dashboard displays a chart of the overall and on-time reporting rates by county and sub-county, also giving a detailed stock status report by facility and sub-county. It also provides a visualization of indicator summary and trends on malaria commodities by displaying the malaria commodity indicators. The Dashboard also shows the trends of malaria commodities based on the supplies. This has accelerated reporting, reduced sudden stock out in facilities, serves as a guide for redistribution of commodities among the facilities, and enhanced accountability for commodities supplied (See Figure 2).
According to Dr. Wambulwa Bernard, the Dashboard has improved efficiency as they are able to order very fast. The orders are rationalized and it warns you when you are either ordering above or below what is required.
The Malaria Dashboard ideally shows us the stock at hand, the opening and closing balances so that from it you are able to know how much you have and how much you are supposed to order. It helps us understand the supply chain indicators such as the reporting rate summary, the facility reporting rate, among others for data quality and reporting rates. It has also improved accountability of commod ities in the supply chain
The Malaria Commodity Dashboard couldn’t have come at a better time also for the majority of the counties that are outside the lake endemic areas i.e., counties in the North Rift and Central regions of Kenya. Malaria commodity orders in such counties used to take longer because there was never a platform that would easily rationalize them. It meant that the order management team at the Malaria Programme would have to go through the orders one by one and rationalize them, unlike with the help of the Malaria Commodities Dashboard. Dr Wambulwa adds
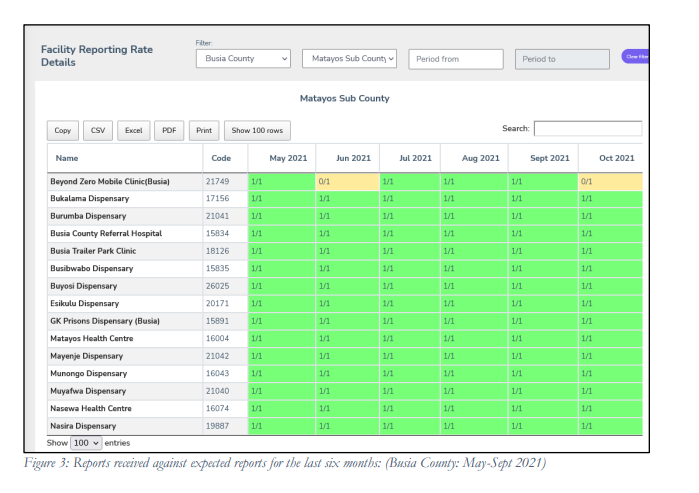
Victoria Ouko, health information officer, Nyakach Sub-County, Kisumu County also stated that prior to the use of the Malaria Commodities Dashboard, they were not getting commodities based on the consumption levels at the health facilities. The Dashboard can be viewed by KEMSA, county and national officials to see the number of patients and drug usage per facility. Planning for the supply of malaria commodities is now based on the consumption per facility. They are also able to check three months data and calculate the buffer or the quantities of commodities required by the health facilities for the said period. In this regard, the Dashboard is an instrumental tool for decision-making on matters malaria commodities supply. The Dashboard has also accelerated reporting as facilities and sub-counties not reporting or reporting late are flagged (See Figure 3).
One of the factors that necessitated the development of this Dashboard is misappropriation of the use of malaria commodities. For example, before the introduction of the dashboard, the differences and inconsistencies in the opening and closing balances of commodities in a facility was rampant and accountability of the same was hard. Nobody used to know where and how many commodities were missing in these facilities. However, with the Dashboard, we are able to see clearly the opening and closing balances of commodities for any given period of time. I can say in this regard, the Dashboard is used as a data quality assessment tool. For the Kisumu team, HealthIT team has trained the county health management team, sub county teams, and pharmacists on the use of the commodities dashboard. HealthIT also involved the County in co-creation of the Dashboard together with other partners. For us in the lake endemic region, it also keeps us on toes and makes one to be keen on the data we are reporting. As malaria is quite prevalent here you know your data will be viewed regularly by anybody so you cannot key data for the sake of keying data, in case of sudden surges and errors in the data, the system will flag it and bring this to the attention of relevant authorities and stakeholders. Counties in the lake endemic region should really adopt this tool for the betterment of their reporting and commodity management. Said Victoria Ouko, HRIO, Nyakatch Sub-County.
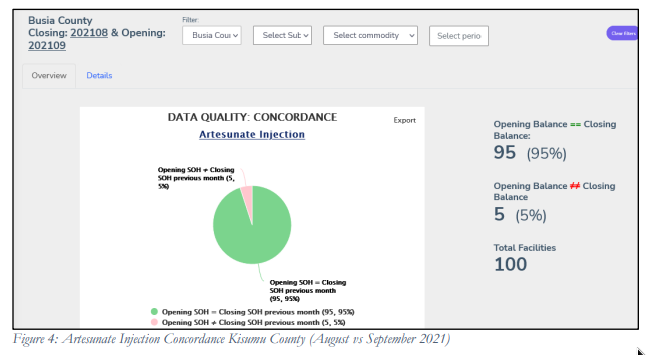
One of the primary objectives of having the Dashboard in place was to strengthen malaria surveillance and use of information to improve decision making on programme performance. This was to be done by way of data quality monitoring, data use, increased use of malaria statistics for decision making, monitoring of epidemic thresholds to inform appropriate response and action (See Figure 4).
Dr. Daniel Nyagah, Embu County Pharmacist said that the Dashboard is a one stop check on the quality of data that the health facilities generate
We are able to pull data for certain periods and see where we need to improve on data accuracy, completeness, determine if some key data elements are missing and address them appropriately with the health facilities. These facilities are also able to clearly see where they need to adjust on data completeness and accuracy. Before we had severe limitations to the aforementioned functions. We had zero visibility and couldn’t make some decisions at our level. HealthIT and partners helped create a much simpler and more accessible commodities dashboard. Now you can look and see which of your regions have chronic problems with data missing. The primary reason for this dashboard is visibility. It simplifies the data mining effort and presents it in a manner that is easy to understand such as charts and tables and can be used for decision making for all stakeholders. Data concordance and completion of malaria reports and their importance is now emphasized with the advent of this dashboard
Onwards to the realization of a malaria free country
The use of the Malaria Commodities Dashboard to inform malaria commodities supply chain as a means to fight malaria is a step in the right direction in the realization of the Ministry of Health, Division of National Malaria Program (DNMP) Kenya Malaria Strategy 2019-2023 goal to reduce malaria incidence and deaths by at least 75% of the 2016 levels towards a malaria free Kenya.
References
- Kenya Malaria Strategy 2019-2023
- Kenya Malaria Indicator Survey 2015
- Kenya Health Information System - https://hiskenya.org
- Kenya Master Health Facility List - http://kmhfl.health.go.ke
Add a comment